Lesson 1: Array Formulas


Welcome to this first lesson! We hope you'll enjoy it while learning a lot. However, we cannot deny that the subject may sometimes be intellectually challenging. To try and ease the pain a bit, we've resorted to the device of introducing a tame imaginary skeptic, who will from time to time voice the reader's own objections or queries. You'll recognize him in the blue parts of the dialogues.

Introduction

I've recently been confronted with a problem that, after some thinking, could be solved with Excel array formulas.

What formulas?

Array Formulas. I understand your consternation though. It's all part of the Excel wizardry thing... Let me first explain what the problem was.

My customer wanted to consolidate data - dynamically of course, this goes without saying - on a dashboard. Data is organized in such a way that every row contains the monthly expected cash flows per project. However, raw data retrieved from the ERP system (I won't mention it) delivers multiple lines for the same project. Don't ask me why! Those software engineers probably had good reasons to develop it this way... GRRRR... Here's how the ERP export looks like:


So, the only thing you need to do is e.g. computing that Project A has an expected incoming cash-flow of $ 3.000,00 in February 2016? And showing that in a separate worksheet?

That's right. And we wanted as well to compute quarterly or yearly revenues / losses. Users of course must be able to choose their projects and reporting period.

Looks pretty easy to me.

I didn't say it was complicated.

You surely used pivot tables, right? And then used the group function to consolidate per month, quarter etc.

Well, no we didn't. Pivot tables won't work here. If the data was transposed it would eventually have worked. But even then, we could not have reached our objective of a dynamic dashboard. That is why we had to refer to Array formulas. Let me explain.

Hold on. How about consolidating data? Or creating an additional column to identify the data to be consolidated? Or write some small VBA code? Or...

Allow me to interrupt you. All of these are good ideas but none - except the VBA option - gives the required output. You could place your extra column just after the dec/16 one but what if the data now contains 2 years instead of just 1? How will you dynamically populate the right one?

Just put in far enough in your worksheet.

I won't even reply to that one. And VBA really is overkill here. Just let me introduce the array formula concept.

Array Formulas explained

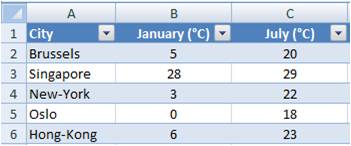
Instead of operating on a single value, array formulas use a range of values. Suppose we would be confronted with the following question. Below is a list of cities and average temperatures for January and July. The question is which city experiences the greatest variation.


You must be kidding, right? I just have to add an extra column, compute the difference for each city and take the MAX value.

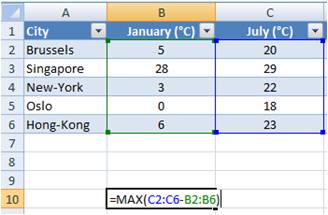
You could do that indeed and obtain the required result. But you can also do it using one single formula:


Hold on. Are we now using the complete C2:C6 and B2:B6 arrays at once when subtracting?

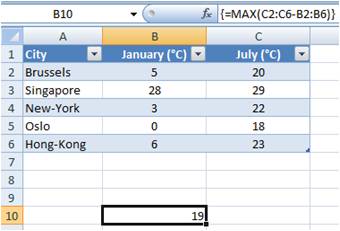
Correct, hence the name Array Formulas. In order however for Excel to recognize you want to use this functionality, you must not just press the ENTER key but the CTRL + SHIFT + ENTER combination after having entered the formula. Excel will recognize this and put the formula between curly brackets:


So, how does it work? Pretty easy. Excel just takes the first item of the C2:C6 array and subtracts the first item from the B2:B6 array. And it continues until the last item has been reached.

So, in our example, I should interpret as (C2:C6-B2:B6) as Excel doing 20°C - 5°C for Brussels, 29°C - 28°C for Singapore, etc. all at once.

Correct! The results are stored in a "destination" array that has the same size or dimensions than the "source" arrays. The MAX function than just looks for the maximum value in the "destination" array, as it always works.

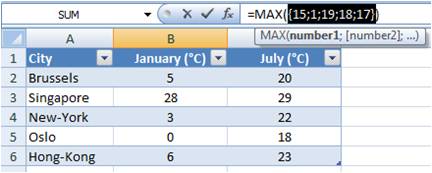
Excel even allows you to have a look at what is happening behind the scenes. If in your formula you decide to select the "C2:C6 - B2:B6" statement and press the F9 key, you'll see the "destination" array Excel has computed:


OK, I can indeed see the expected results, 15 being 20 - 5, 1 being 29 - 28 etc. So, no more extra columns?

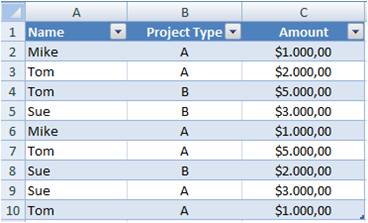
Nope. I'll show you some other magic. In the example below you're asked to compute for how much projects of type "A" Tom has sold.


I know, I'll use a pivot table and...

Think again, although pivot tables will work here.

Wait, can I use Array Formulas as well?

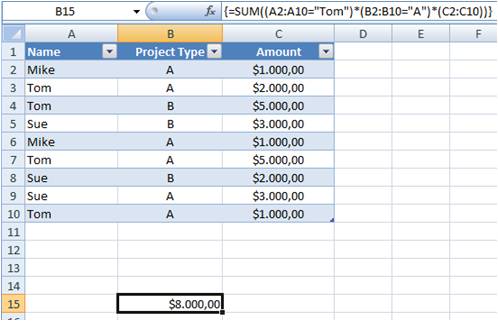
Of course. Let me show you how. Remember the only thing Array Formulas do is just applying some logical operators to arrays instead of single values. For the example here above, the reasoning to be applied is: if name is "Tom" and Project Type is "A" then add the amount. I'll immediately jump to the formula to use and explain it afterwards:


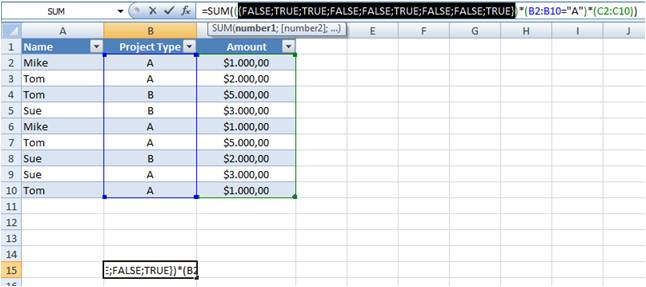
As you can see when pressing F9, the first array "A2:A10="Tom"" is just an array containing TRUE's or FALSE's:


Excel will interpret these as "0" or "1". The same rules for the second array "B2:B10="A"".

As we now know, Excel will compute the following: (item 1 of array 1 * item 1 of array 2 * item 1 of array 3) + (item 2 of array 1 * item 2 of array 2 * item 2 of array 3) + ... + (item 9 of array 1 * item 9 of array 2 * item 9 of array 3)

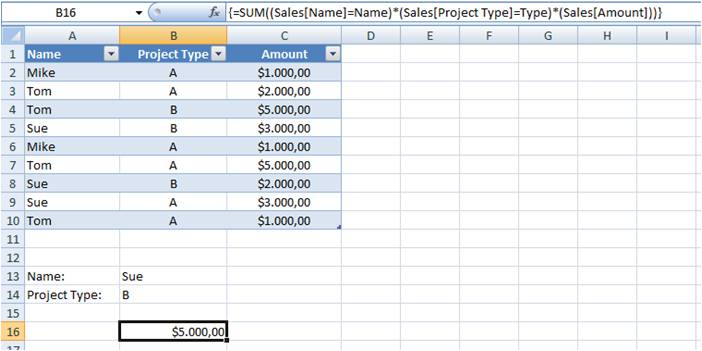
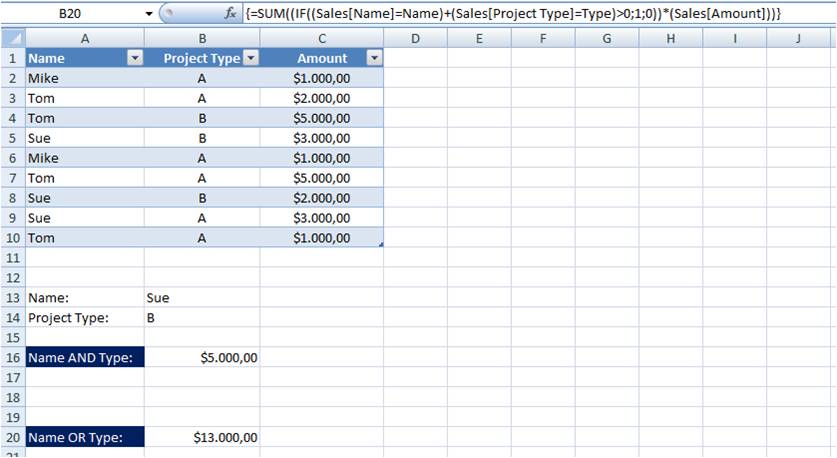
If we rename our table "Sales", cell B13 "Name" and cell B14 "Type", we can adapt our formula to use these named ranges and obtain a certain amount of dynamism, as we can change the values of these cells in order to see the desired result:


This is indeed handy if I'm looking for a match between sales person AND project. But what if I need the one OR the other?

Here is the answer! I'll let you think about it...


You can download this example here

Don't forget to always confirm the formula by entering CTRL + SHIFT + ENTER!

Back to our initial problem

Let's go back to our initial example and see how this wonderful feature can be of any help. As a reminder, this was our table:


Let us first concentrate on being able to choose a project as well as a month and compute the monthly total revenue. The formula looks like this:


Where "Project" refers to the cell used for project selection and "Dates" refers to the column headers from 1/1/2016 till 1/12/2016. If the selected project is "Project A", the first array "Sheet1!$A$2:$A$11=Project" of our formula contains:


If the selected month is February and the year is set to 2016, the corresponding arrays are for "Month(Dates)=Month":


and for "Year(Dates)=Year":


If the sum of the corresponding items is 3, than we have a match for all 3 criterias!

Wait a minute...

Finally! I thought you fell asleep!

If I understand it well, you search among range A2:A11 for projects matching the selection, returning an array of 10 items, being 0's and 1's, or TRUE's and FALSE's. You then check for the dates and the years, but these are arrays of 12 items. How can you sum these up? And how does this matches with summing items in the table B2:M11 containing much more data???

Good remark! Have a closer look at our first array:


As you'll notice, the separator used is a semicolon, meaning each data item is stored in a different row:


Where TRUE is set each time Project A is encountered.

The other 2 arrays use a backslash as separator, meaning data is organized in columns and as a result look like this:


The first row contains TRUE for February (the selected month) whereas the second row is always TRUE there all dates are in 2016. So what happens next? Well, Excel is confronted with an array of 10 rows and two arrays of 12 columns. It will automatically create an array containing 10 rows and 12 columns to store its data in. Each cell will contain the sum of the respective row and column as shown hereunder:


The IF clause is then applied. Excel will go through each item of the matrix here above and, if the item equals 3 retain the corresponding item of the B2:M11 data range (which now have exactly the same size), the other one's being set to 0 (or false). SUM will take the sum of all elements in the array so as to obtain the required result.

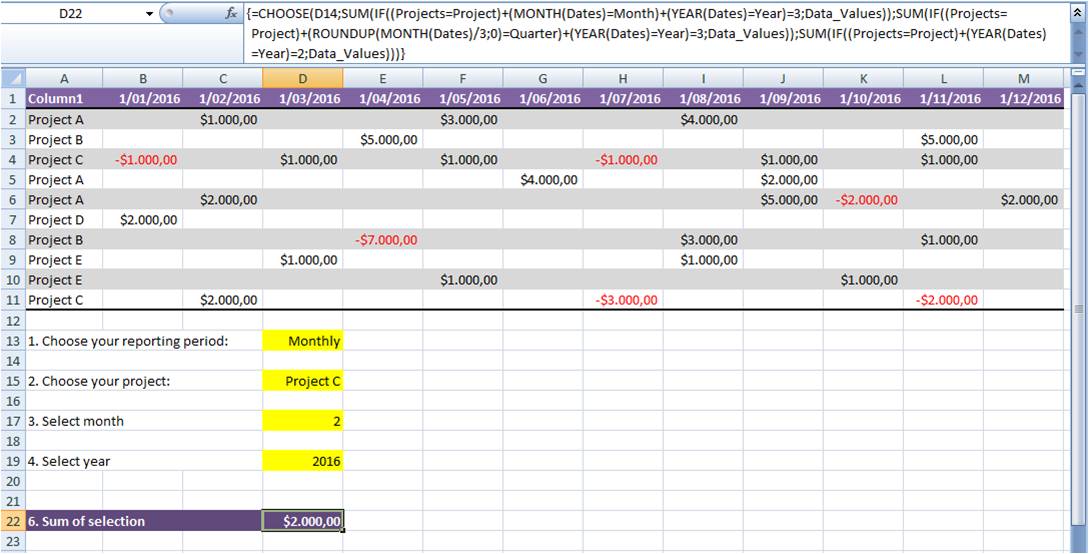
The same logic can be applied for the quarterly or yearly reporting and using the CHOOSE function, the user is able to add some dynamism in its dashboard. Using conditional formatting, the final result looks as shown below and can be downloaded here:


Good to know, and to remember...

Array formulas will not solve all your spreadsheet problems. Use them without taking care and you'll unfortunately pay the price... Only use them when needed as array formulas will significantly slow down your Excel application.

Please as well keep in mind that:

  • CTRL + SHIFT + ENTER should be pressed simultaneously in order for Excel to recognize a formula as an array formula;

  • You cannot add the {braces} yourself;

  • Array formulas do not work on an entire column;

  • Using array formulas will not render your application very transparent as they are not easy to read and understand for most Excel users, even experienced ones.

  • The purists will use a double hyphen ( - - ) in front of a boolean table in order to translate TRUE's and FALSE's into 1's and 0's. When negating something, Excel will convert the value to a number and of course reverse the sign. Adding a second negation will reverse the sign again and will just leave the required number. Some formulas might throw an error if this is omitted.

We appreciate your feedback!


About Cintellis

Let us surprise you with how much more you can achieve by using Excel and VBA based products.

Are you looking for an on the level, reliable and trustworthy company that will surprise you with how much more you can achieve by using Excel and VBA based products? Learn more about our philosophy, products, services or contact us for more info.


About Numis

Flexible, cheap and very short implementation time, discover Numis, our Excel based Cash Management and Management Accounting Software and experience a totally new way to analyse and report on your cash positions.

At Numis, we help you to get more out of your financial data than you thought possible. From enhanced reporting functionalities and detailed analysis to providing enterprise budgeting and forecasting solutions, we will help you to achieve your business objectives. When using Numis, you can share your analysis and strategy with your business partners, suppliers or employees as needed.

Numis is a product from Cintellis bvba & FS&P bvba.

CONTACT Us

You can contact us by phone, mail or by filling out the form below.

Corporate address:
Alsembergsesteenweg 588
1653 Dworp
Belgium

Phone Numbers:
+32 (0)471 65 19 66

E-Mail: info@cintellis.com